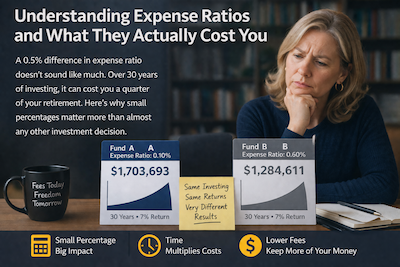
Most investors check expense ratios the same way they check nutrition labels — they glance, conclude it's "probably fine," and move on. This is an expensive mistake. Expense ratios are the single most reliable predictor of long-term fund returns, more reliable than past performance, manager tenure, or any other metric. A fund that costs 0.03% will, on average, beat an otherwise-identical fund that costs 1.0% by about 0.97 percentage points per year, every year, indefinitely.
That 0.97% doesn't sound like much. Here's what it actually costs you.
What an Expense Ratio Is
An expense ratio is the percentage of fund assets that gets deducted annually to pay for the fund's operating costs — fund manager salaries, administrative expenses, legal fees, marketing, custody, and profit margin for the asset manager. It's expressed as a percentage of assets under management.
If a fund has a 0.50% expense ratio and you have $100,000 invested, the fund deducts $500 per year from your position. But it doesn't show up as a bill you pay. Instead, it's continuously deducted from the fund's net asset value (NAV), which means your stated returns are already after expenses. You never see the charge line-item; it just makes the fund's reported returns slightly lower than the underlying index's returns.
This is why expense ratios are sometimes called "invisible." The money leaves your account, but not in a way you can see on a statement.
What's Reasonable (and What Isn't)
Benchmark expense ratios as of 2024:
Index funds and ETFs
- Broad US stock market: 0.03% (Fidelity FZROX, Vanguard VTI/VTSAX)
- S&P 500 index: 0.03%–0.04% (Vanguard VOO/VFIAX, Fidelity FXAIX)
- Total international stock: 0.07%–0.11%
- Total US bond market: 0.03%–0.05%
- Small-cap, emerging-markets, sector ETFs: 0.10%–0.30%
Target-date funds (retirement-dated all-in-one funds)
- Vanguard Target Retirement: 0.08%
- Fidelity Freedom Index: 0.12%
- Schwab Target: 0.08%
- Target-date funds in 401(k) plans: vary widely, 0.05%–0.75%+
Actively managed funds
- Typical actively managed stock mutual fund: 0.60%–1.20%
- Closed-end funds, niche products: often 1.5%–2.5%
Hedge funds and alternatives
- Traditional "2 and 20" (2% management fee + 20% of profits) — still common, extremely expensive, almost never worth it for retail investors
- Liquid alternatives and niche ETFs: 0.70%–1.50%
Variable annuities and insurance products
- Mortality and expense charges + fund fees + rider fees: often 2.0%–3.5% all-in
- These are the highest-cost wrappers in common retail use
The Compounding Cost Over Time
The reason expense ratios matter so much is that small percentages compound into enormous dollar amounts over a career. Here's the math with a $500,000 starting portfolio invested for 30 years at an underlying 7% market return:
| Expense ratio | Effective return after fees | Ending balance |
|---|---|---|
| 0.05% | 6.95% | $3,780,000 |
| 0.30% | 6.70% | $3,538,000 |
| 0.75% | 6.25% | $3,102,000 |
| 1.00% | 6.00% | $2,871,000 |
| 1.50% | 5.50% | $2,488,000 |
| 2.00% | 5.00% | $2,160,000 |
A 0.05% index fund vs. a 1.00% actively managed fund: $909,000 difference over 30 years on the same $500,000 starting investment. Nearly a million dollars, for what looks on paper like a tiny percentage difference.
A 0.05% index fund vs. a 2.00% variable annuity: $1,620,000 difference. Over three quarters of the ending balance.
The effect is nonlinear — each incremental basis point matters less as you go up the expense ratio scale, but the total absolute cost climbs dramatically. And this math assumes you start with $500,000. For someone who's contributing over a working career and ending up with a $2M portfolio, the dollar difference grows even larger.
Beyond the Expense Ratio
The expense ratio is the single most important fee number — but it's not the only cost of owning a fund.
Trading costs (turnover drag)
Funds with high turnover (lots of buying and selling inside the fund) generate transaction costs and tax consequences that aren't captured in the expense ratio. Index funds have low turnover (typically 2%–10% annually); actively managed funds often have 30%–100%+ turnover. This trading drag typically adds 0.10%–0.50% of additional cost on top of the stated expense ratio for active funds.
Tax inefficiency
In taxable accounts, funds that distribute large capital gains each year force shareholders to pay taxes on gains they didn't personally realize. This is the structural tax disadvantage of mutual funds vs. ETFs (see our index funds vs. ETFs guide). The hidden tax cost can be 0.20%–0.50% annually in taxable accounts.
Bid-ask spreads (for ETFs)
ETFs have a bid-ask spread — the difference between the price to buy and the price to sell. For the largest, most liquid ETFs (VOO, SPY, VTI, BND) the spread is effectively zero (a penny or two on shares priced in hundreds). For niche or low-volume ETFs, spreads can eat 0.10%–0.30% per round-trip.
12b-1 fees
Some mutual funds charge "12b-1 fees" — marketing and distribution expenses. These are rolled into the expense ratio so they're not technically hidden, but they don't benefit you. A 12b-1 fee means the fund is paying a broker to sell you the fund. That's a fee you're paying for someone to be sold the fund. Which is you. Not great.
Loads
"Front-end loads" (fees paid at purchase, typically 3%–5.75% of the investment) and "back-end loads" (fees paid at sale) are another structural cost mostly confined to advisor-sold mutual fund share classes. Avoid them entirely. Any fund with a load has a no-load version available somewhere; you're almost never getting anything meaningful for the load.
Share Classes and Hidden Discounts
The same mutual fund often has multiple share classes — Admiral, Institutional, Investor, Class A, Class C, R6, etc. — each with a different expense ratio. The expense ratio differences reflect minimum investment amounts, distribution channels, and historical artifacts.
Vanguard Admiral vs. Investor shares: Admiral (typically $3,000 minimum) has a lower expense ratio than Investor shares of the same fund. On VFIAX (S&P 500) the Admiral class is 0.04% vs. older Investor shares at 0.14%.
Institutional shares in 401(k) plans: Your 401(k) may give you access to institutional share classes (class R6, Z, or similar) with expense ratios substantially below what you'd pay retail for the same fund. If you're deciding whether to roll an old 401(k) to an IRA, check whether your current plan has institutional pricing you'd lose.
Fidelity Zero funds (FZROX, FZILX, FXNAX): 0% expense ratio. They achieve this by using proprietary indexes rather than standard ones (S&P, MSCI, Bloomberg) and making up the cost elsewhere. Only available inside Fidelity — you can't transfer these funds to another brokerage without selling first.
Red Flags in Your Statement
Open your 401(k) or IRA statements. Look for:
- Any fund with an expense ratio over 1.0% unless there's a clear reason (specialty alternative, niche international, etc.)
- 12b-1 fees (line-item disclosed on the fund's prospectus, typically 0.25%–1.00%)
- Front-end or back-end load noted in the share class name (e.g., "Class A" often has a front load)
- Wrap fees or advisory fees stacked on top of the fund's own expense ratio — this is common in advisor-managed accounts
- Variable annuity riders charging 1%–2% for guaranteed lifetime withdrawal benefits, death benefits, or similar features that you may or may not actually value
What to Actually Do
1. Calculate your portfolio's weighted expense ratio.
Add up how much you have in each fund × that fund's expense ratio. Divide by total portfolio value. That's your average expense ratio.
Reasonable target: 0.10%–0.20% for a broadly diversified index portfolio.
If you're above 0.50%: there's almost certainly room to cut costs without sacrificing diversification.
If you're above 1.00%: something is materially wrong — either you're in high-fee actively managed funds, in a high-fee annuity, or paying a wrap fee on top of mutual funds you could hold directly.
2. Replace high-fee funds with index equivalents where possible.
For any actively managed fund in your 401(k), ask: is there a lower-cost index option that covers the same asset class? In almost every 401(k) plan, there is. The index alternative won't match the active fund's best year, but it will almost certainly beat it over a decade.
3. Audit 401(k)s from old jobs.
These are where most fee leakage happens — expensive target-date funds you inherited from a prior employer's default, with no review. Rolling an old 401(k) to an IRA gives you access to ultra-low-cost options you may not have in the employer plan.
4. Be cautious about advisor wrap fees.
A 1% AUM advisory fee on top of 0.60% internal fund expenses is a total cost of 1.60% per year. Over 30 years on a $500K portfolio, that's approaching $1.5M of lost compounding. The advisor needs to provide at least that much value in tax planning, behavioral coaching, and other services to be worth it. Many do; many don't.
The Bottom Line
Expense ratios are the most controllable variable in long-term investment returns. You can't predict markets. You can't reliably pick winning managers. You can, however, pick low-cost index funds and save yourself hundreds of thousands of dollars over a career for almost no effort.
The dollars at stake compound in a way that's hard to appreciate at the time. A 0.25% fee difference feels like nothing in year one. Over 30 years it's often worth a house.
If you'd like a portfolio audit for fee leakage, our directory lists fiduciary advisors who specialize in investment management across every state. Verify any advisor on FINRA BrokerCheck before you commit.